Threats Dashboard: Turn Current Intelligence into Priorities
Use the isMalicious Threats dashboard to move from a broad threat picture to the sectors, ransomware groups, malware, victims, and evidence that matter to your team.
 IsMalicious Team
A threat feed can produce thousands of observations without answering the question a security team faces each morning: what deserves attention now?
The isMalicious Threats dashboard starts with that decision. It organizes current intelligence around sectors, ransomware groups, malware, victims, and supporting context. Analysts can scan the broad picture, select the part that affects their organization, and then move into evidence or response.
This approach follows the operational definition in NIST SP 800-150: cyber threat information includes indicators, adversary tactics, suggested actions, and incident-analysis findings. A useful dashboard therefore needs to connect technical observations with actors, targets, and decisions.
Start with Exposure, Not Volume
The largest count is rarely the best priority. A burst of activity against an unrelated sector may be less urgent than a smaller campaign targeting the software, geography, or business model your organization depends on.
Begin with three questions:
- Which sectors are seeing new or sustained activity?
- Which ransomware groups or malware families are associated with that activity?
- Does the evidence overlap with your assets, suppliers, users, or open incidents?
The Threats dashboard gives you several paths into the same picture. Use the overview for orientation, then open the relevant sector, group, or malware profile. This is faster than treating every feed item as an isolated alert.
Drill into a Sector
A sector page turns an abstract trend into an exposure view. It brings together:
- a current risk level;
- attacks observed this month and this year;
- the total set of known victims;
- the threat groups most active against that sector;
- a timeline of recent victims;
- related press coverage for additional context.
This combination helps an analyst distinguish a recurring background pattern from a change that needs investigation. The victim timeline shows recency. The group cards show who is driving the activity. Related coverage helps explain events that raw counts cannot.
If your organization works in several industries, review the primary business sector first, then repeat the check for critical suppliers. Third-party exposure often appears outside the category used for your own company.
Follow the Actor, Malware, and Victim Links
Sector context is only one direction. A group profile lets you follow the actor across victims and campaigns. A malware profile helps connect names, capabilities, and observed activity. Victim details give the event a concrete target and date.
Use these relationships to form a testable intelligence question. For example:
Is the group targeting our sector also using infrastructure, malware, or initial-access methods visible in our environment?
The next step is evidence, not assumption. Copy the relevant domain, IP, URL, or hash into Smart Lookup, or place several related indicators in a composite threat report. The dashboard identifies the investigation. The reports help validate it.
Turn Intelligence into a Daily SOC Routine
A short, repeatable review is more useful than an occasional deep browse:
- Open the Threats dashboard at the start of the shift.
- Review sectors that map to the organization and its critical suppliers.
- Note new groups, victims, or malware that changed since the previous review.
- Open the supporting context before assigning urgency.
- Check any concrete indicators in a full report.
- Send confirmed work to Alerts and Action Center.
- Record the decision and the reason for it.
This routine creates a clean boundary between awareness and action. Not every new victim becomes a case. Not every mention of a group becomes an alert. The analyst advances only the intelligence that intersects with the environment or a defined intelligence requirement.
Use Sources to Judge Confidence
Two conclusions can have the same headline and very different evidentiary weight. Before escalating, check whether the finding is supported by independent sources, whether those sources are fresh, and whether the evidence is direct or repeated from another feed.
The Sources and Intelligence guide explains how to read source freshness, contribution, agreement, and coverage inside isMalicious. That context is especially important for emerging groups, newly reported victims, and infrastructure that changes quickly.
For response planning, pair the dashboard with the incident response playbook. The dashboard tells you what is changing. The playbook defines who validates, contains, communicates, and preserves evidence.
Avoid Three Common Mistakes
First, do not rank threats by count alone. Add relevance, recency, evidence quality, and exposure.
Second, do not treat a related article as confirmation. Press reporting is context. Verify concrete indicators and affected assets through technical evidence.
Third, do not keep a valuable finding inside the dashboard. If it affects your organization, convert it into a tracked alert, action, report, or case with a named owner.
From Threat Picture to Defensible Action
The Threats dashboard works best as the first stage of a connected workflow:
- understand activity in Threats;
- validate indicators in Smart Lookup;
- inspect the supporting source intelligence;
- prioritize response in the alerts inbox;
- preserve reusable evidence in Reports.
That sequence keeps the broad view useful. It turns changing threat activity into a smaller set of questions, validated findings, and owned actions.
FAQ
Frequently asked questions
What is the isMalicious Threats dashboard for?
It is an operational starting point for reviewing current threat activity, then drilling into sectors, ransomware groups, malware families, victims, and related reporting without rebuilding the context in separate tools.
Can I investigate a specific business sector?
Yes. Sector views summarize the current risk level, recent and yearly attack activity, known victims, leading threat groups, and related press coverage for the selected sector.
Does the dashboard replace an indicator report?
No. The dashboard helps you decide what deserves attention. Use an individual or composite report when you need evidence about a specific IP, domain, URL, hash, or other indicator.
How should a SOC use the dashboard each day?
Start with changes in sectors and groups relevant to the organization, open the strongest supporting context, then create or update alerts and response work only for findings that affect the environment.
Can the Threats dashboard support ransomware monitoring?
Yes. It connects ransomware groups, sector exposure, recent victims, malware context, and related coverage so analysts can monitor the activity most relevant to their organization.
Related articles
 IPv6 Threat Intelligence: Reputation Beyond IPv4
Build IPv6 threat intelligence with correct normalization, prefix context, dual-stack logging, enrichment, and reputation decisions that avoid overblocking.
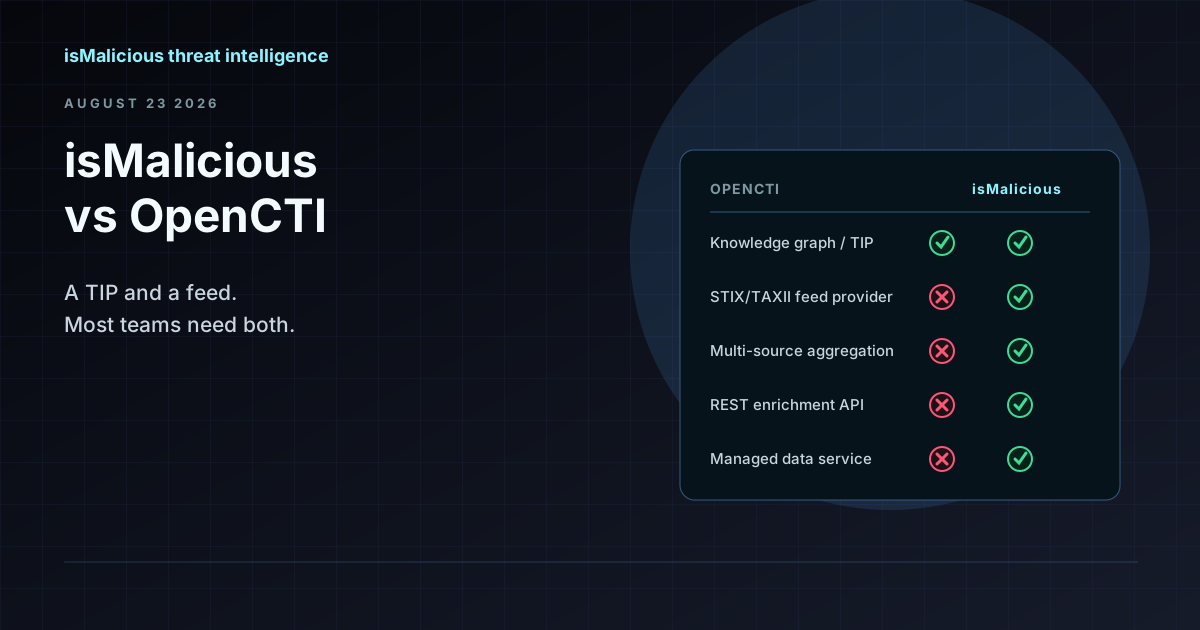 isMalicious vs OpenCTI: Why This Is the Wrong Comparison (and How They Work Together)
OpenCTI is a threat intelligence platform and knowledge graph. isMalicious is a data provider that feeds it. Teams searching for an OpenCTI alternative usually need a feed, not a replacement TIP.
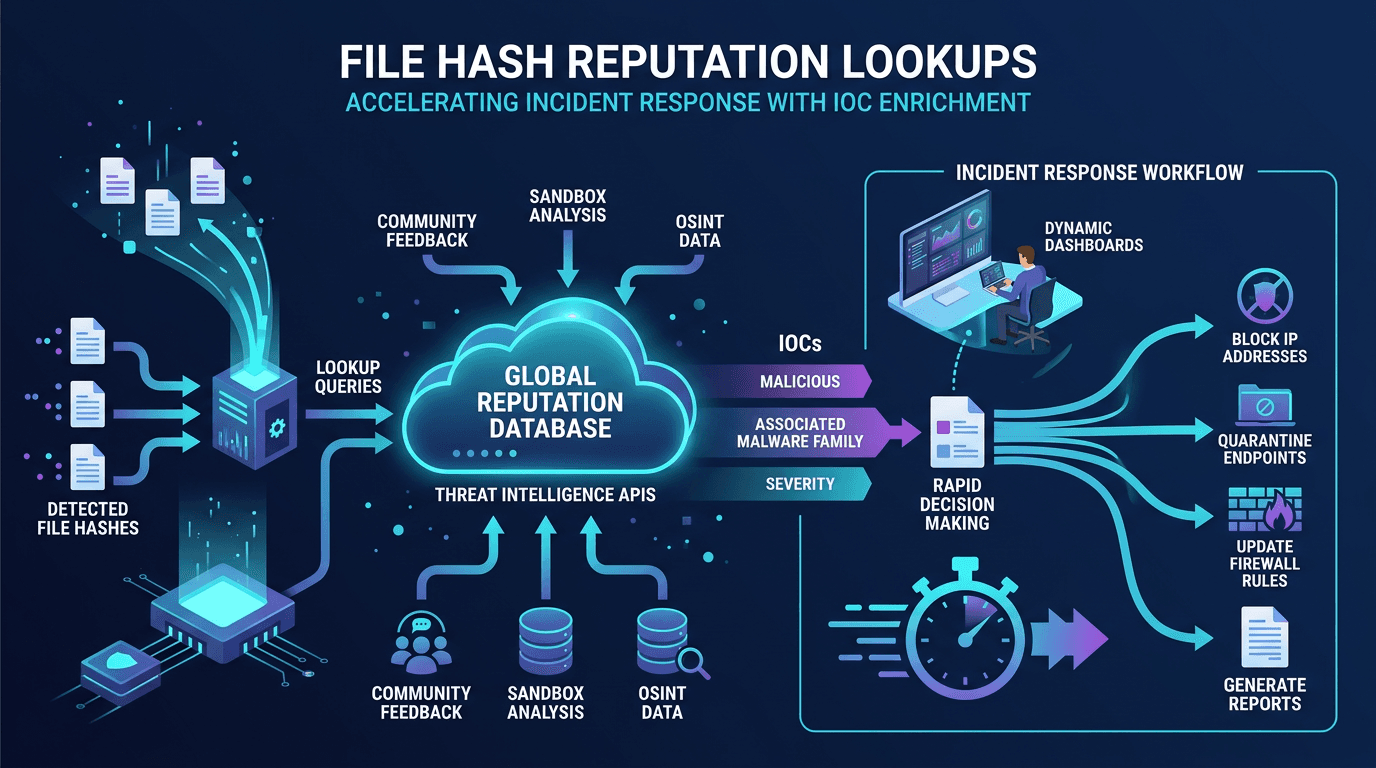 File Hash Reputation Lookups: Accelerating Incident Response With IOC Enrichment
A practitioner's guide to file hash reputation lookups—how they work, which data sources power them, how to build automated IOC enrichment pipelines, and how to integrate hash intelligence into SOC, SOAR, and incident response workflows.
Check any IP or domain
See what our indexed threat intelligence records say about it.
Try the IP / Domain Checker