Building a Custom SOC Dashboard: Integrating Real-Time Threat Feeds
Enhance your Security Operations Center visibility. A step-by-step guide to aggregating threat data, enriching logs, and building custom security dashboards using modern Threat Intelligence APIs.

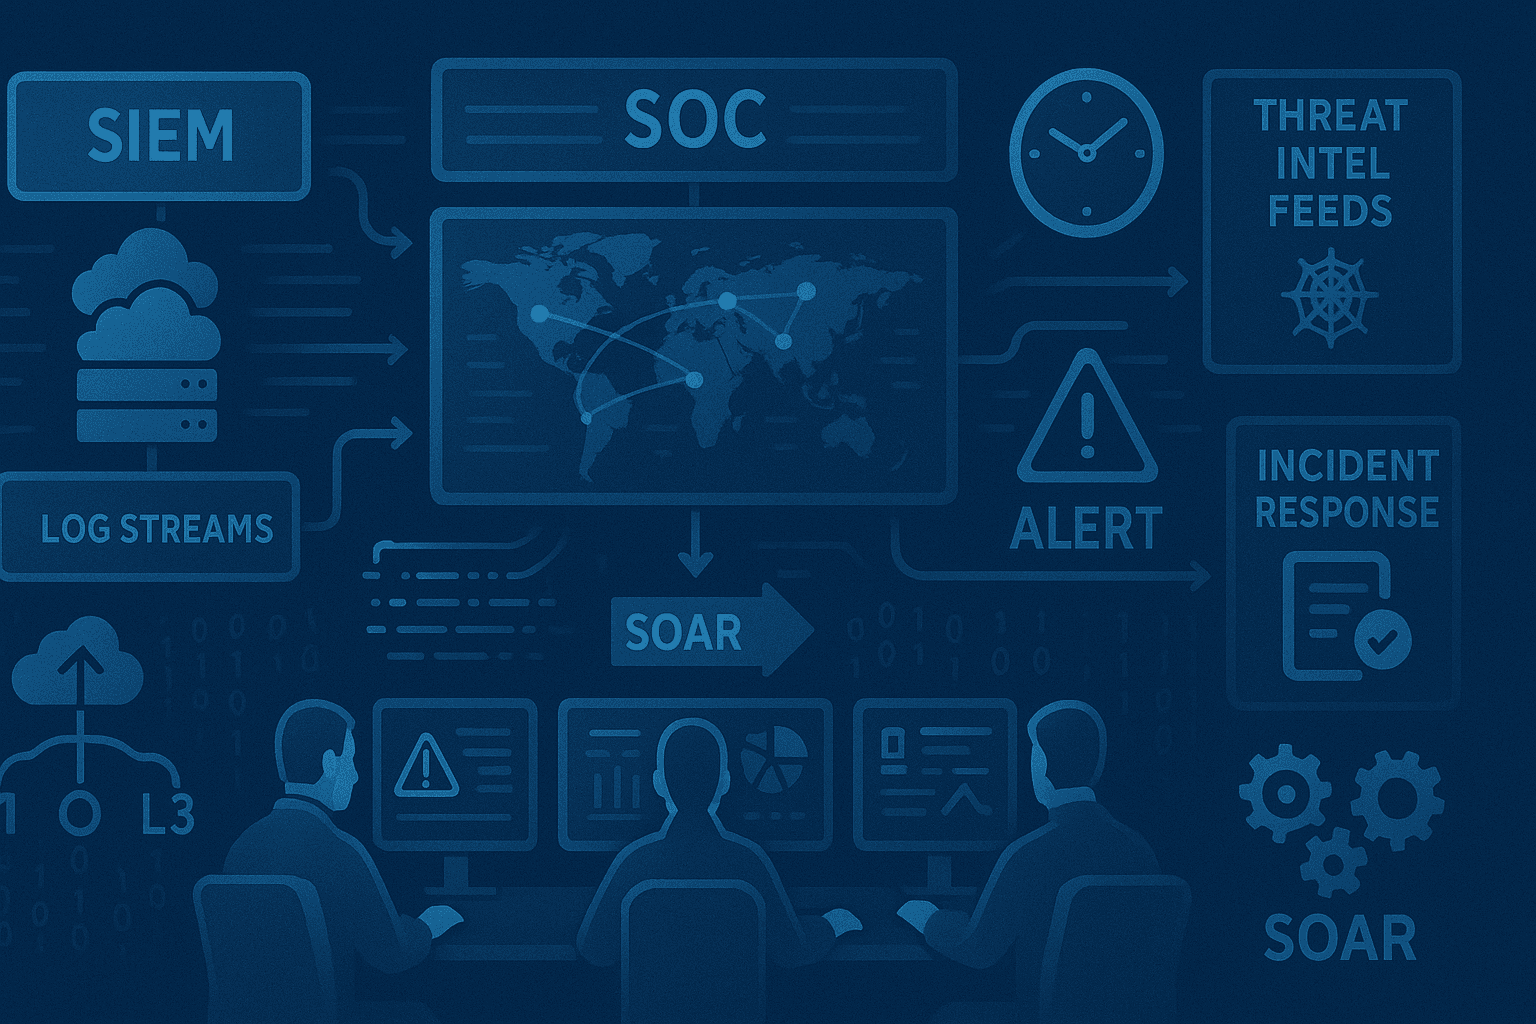
The modern Security Operations Center (SOC) is drowning in data. With firewalls, endpoint detection and response (EDR) agents, intrusion detection systems, and identity providers all generating massive volumes of logs, analysts are suffering from severe alert fatigue.
A SIEM (Security Information and Event Management) system correlates this data, but without proper context, a log is just a log. Is an inbound connection from 203.0.113.50 a normal web crawler, or a known Command and Control (C2) server?
To give SOC analysts the visibility they need to prioritize and triage effectively, you must build dashboards enriched with Real-Time Threat Intelligence feeds.
Why Enrich Your Logs?
If a SOC analyst sees an alert for a failed login attempt, their first step is usually to copy the IP address, pivot to a third-party threat intelligence site, run a search, and wait for the results.
If you are seeing thousands of failed logins, this manual pivot is impossible to scale.
Log enrichment automates this process. By integrating Threat Intelligence APIs directly into your ingest pipeline or SIEM, every log arrives at the dashboard already tagged withcontext.
Instead of seeing:
Failed Login - IP: 203.0.113.50
The analyst sees:
Failed Login - IP: 203.0.113.50 [High Risk: Known SSH Brute Forcer] [ASN: HostGator] [Geo: Brazil]
This context allows the analyst to make an immediate, informed decision.
Aggregating Data for the Custom Dashboard
Building a successful SOC dashboard requires aggregating internal telemetry with external intelligence.
1. Identify Your Data Sources
Start by routing your most critical telemetry into your logging infrastructure (e.g., Elasticsearch, Splunk, Datadog, or customized OpenSearch clusters).
- Firewall Deny/Allow logs
- Web Application Firewall (WAF) blocks
- Identity Provider (Okta, Entra ID) authentication logs
- DNS query logs
2. Implement the API Enrichment Layer
You do not want your SIEM to query an external API for every single log message—that will bankrupt your API limits and introduce latency.
Instead, implement a lightweight enrichment script (often using Logstash, Fluentd, or a custom Lambda function) that sits between your log shippers and your database.
- The script extracts IPs, Domains, and File Hashes from incoming logs.
- It checks a fast, local cache (like Redis) for known threat scores.
- If there is a cache miss, it queries the Threat Intelligence API.
- It appends the retrieved threat score, categories (e.g., 'Malware', 'Botnet', 'Tor Node'), and location data as new JSON fields before writing the log to the database.
Designing the SOC Dashboard: What to Visualize
A dashboard must be actionable. Here are the key visualizations your enriched data enables:
Total Traffic vs. Malicious Traffic
Create a time-series graph that displays total network hits overlaid with traffic explicitly originating from IPs tagged as malicious. A sudden spike in the malicious volume without a corresponding spike in total traffic indicates a targeted attack, often an automated credential stuffing campaign.
Threat Geography Heat Maps
While geo-blocking entire countries is rarely effective long-term, visualizing where malicious traffic originates helps analysts identify shifts in attacker infrastructure. A sudden wave of malicious authentication attempts from an unusual ASN or region warrants immediate investigation.
Top Targeted Endpoints by Threat Category
If your WAF logs are enriched, you can build a table showing which URIs are being targeted by different threat actor profiles. Are 'Known Scanners' hitting your /api/v1/health endpoint? Are 'Known Exploit IPs' targeting your /wp-login.php path?
High-Fidelity "Action Required" Queues
The most valuable widget on a SOC dashboard is the filtered queue. Use the enriched threat scores to build a "Critical Review" table. Show only the logs where:
Action = 'Allowed' AND Threat_Score > 90
This immediately highlights the most dangerous events: highly malicious infrastructure successfully bypasses your prevention tools. Analysts must investigate these immediately.
Integrating Automated Response (SOAR)
A dashboard provides visibility, but true maturing in a SOC requires Security Orchestration, Automation, and Response (SOAR).
Once your dashboard proves that the Threat API enrichment is accurate and high-fidelity, you can automate the response. If your WAF logs show an IP with a critical threat score attempting to access an administrative panel, a webhook can automatically push that IP to edge firewalls for an immediate, global block across your infrastructure.
The Foundation of Visibility
Building a custom SOC dashboard enriched with real-time threat intelligence transforms your security operations from a reactive, manual slog into a data-driven, highly efficient machine.
To power your dashboards with the most accurate, zero-latency context, integrate the isMalicious Real-Time Threat Intelligence API. Give your analysts the insights they need to distinguish the noise from the critical threats.
Related articles
 Jun 4, 2026SOC Alert Fatigue: How Threat Intelligence Reduces False Positives Without Hiding Real Attacks
Alert fatigue is not a staffing problem alone. SOC teams need better evidence, source quality, confidence bands, and enrichment workflows that turn noisy alerts into defensible decisions.
 Mar 17, 2026Integrating MITRE ATT&CK with Real-Time Threat Feeds
Bridge the gap between strategic frameworks and tactical defense. Learn how to map real-time threat feeds directly to the MITRE ATT&CK matrix.
 Sep 15, 2025Building a Modern SOC with Threat Intelligence: A Practical Guide
Learn how to build an effective Security Operations Center (SOC) powered by threat intelligence. Discover essential tools, processes, and best practices for detecting, analyzing, and responding to cyber threats in real-time.
Protect Your Infrastructure
Check any IP or domain against our threat intelligence database with 500M+ records.
Try the IP / Domain Checker